Governments at all levels invest a lot in greening Australian suburbs. Yet, in a recent report, we show that the greening efforts of most of our metropolitan local governments are actually going backwards.
Originally published on The Conversation – 27 September 2017
Authors: Marco Amati, Alex Saunders, Bryan Boruff, Drew Devereux, Kath Phelan, Peter Caccetta
This is a puzzle, as greening has clear environmental and economic benefits. The environmental benefits are obvious and relatively easy to count. For private home owners, numerous studies have linked greening to a range of economic benefits from energy savings to higher house prices.
So how do we explain the loss of green cover?
How we tracked the changes
Our research aimed to assess urban greening efforts and what accounts for the gains and losses.
Based on i-Tree, a well-known method for sampling urban vegetation distributions and associated land covers, we compared 2016-17 figures with an early assessment that ranged from 2008 to 2013 to examine changes in vegetation cover by local government area.
The report shows that large variation exists nationally in the growth and loss of tree canopy. Losses and gains can often be explained, however, by the changing nature of urban vegetation as neighbourhoods are transformed over time.
For example, in the graph highlighting the extent of tree canopy cover change for metropolitan local governments, Glenorchy in Tasmania shows the greatest tree canopy loss between 2008 and 2015 (more than 15 percentage points). Yet a gain in shrub area of more than 12% largely offset this canopy loss.
Similarly, Armadale in Western Australia gained more than 12% of tree canopy cover between 2011 and 2015 but lost more than 15% of shrub cover.
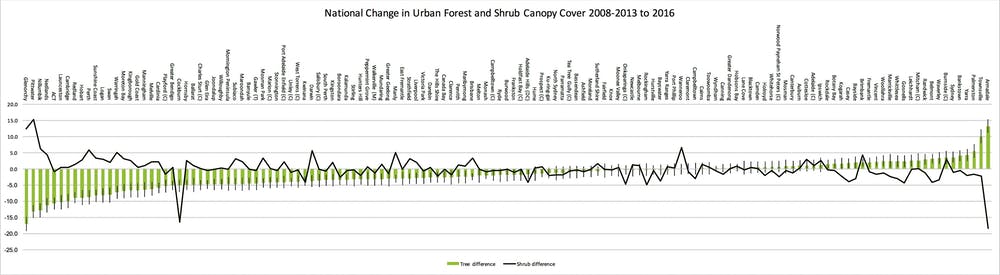
Loss of canopy from 2008-2013 to 2016 for all 139 metropolitan local government areas
Metropolitan local governments in Australia are very diverse in size and land use. The largest in our study, Cairns Regional Council in Queensland, is 1,500 times the area of the smallest, Peppermint Grove in inner-city Perth.
Some local government areas are dominated by non-urban land uses. This means natural processes such as bushfires, drought and forest regrowth are going to significantly affect greening efforts. Others are going to be affected by urban densification and housing growth.
Understanding greening efforts as a function of canopy loss alone is problematic for some local governments. Instead, a more appropriate measure may be the total change in urban greenery (canopy, shrubs and turf) between the two study periods. These results show that 54 out of the 139 local governments (39%) studied had suffered statistically significant losses in total green space.
Added up across Australia’s major metropolitan regions, this amounts to vegetation loss of 2.6% in our urban environments. This doesn’t like sound much, but it is equivalent to 1,586 square kilometres – a larger area than the City of Brisbane.
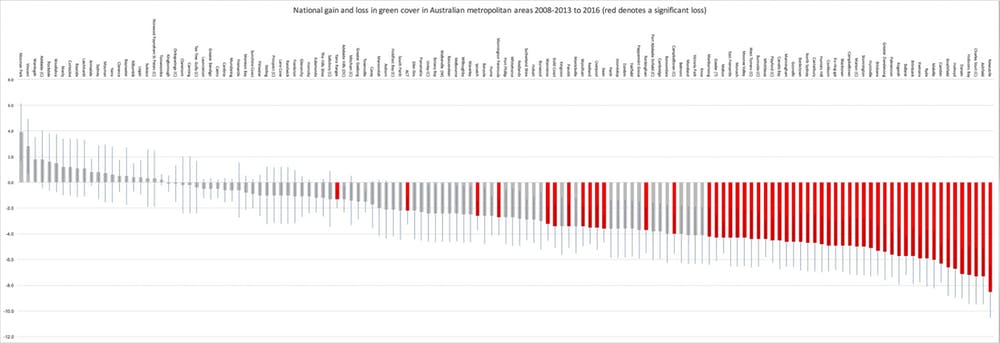
Loss of total green space (canopy, shrubs and turf) from all 139 metropolitan local government areas. Red indicates a statistically significant loss to 95% certainty.
What explains this decline?
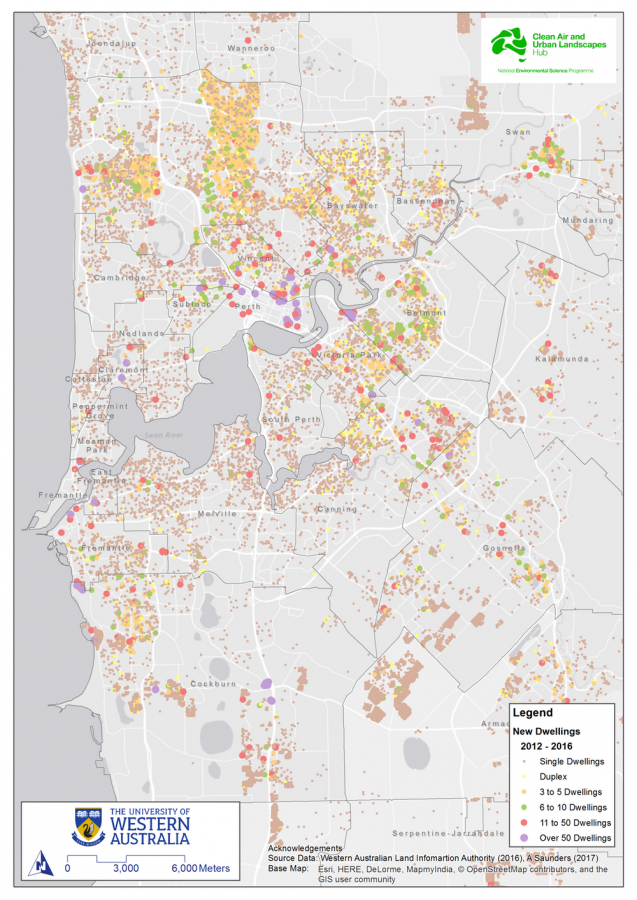
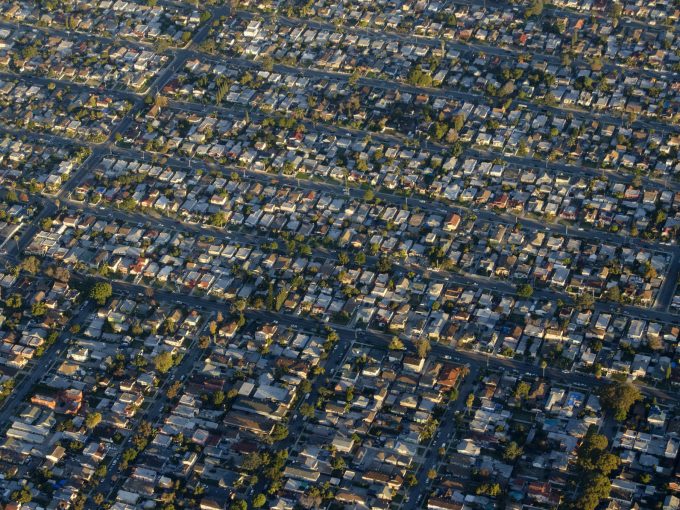
New developments across Perth show densification in selected locations. WA Land Information Authority (2016)/Alex Saunders (2017)
The location of many of the local government areas suffering more than 5% loss in green space provides clues to the types of processes driving this loss. For example, Newcastle in New South Wales lost 8.5% of its green space during our study period largely due to losses in grass cover as a result of greenfield development.
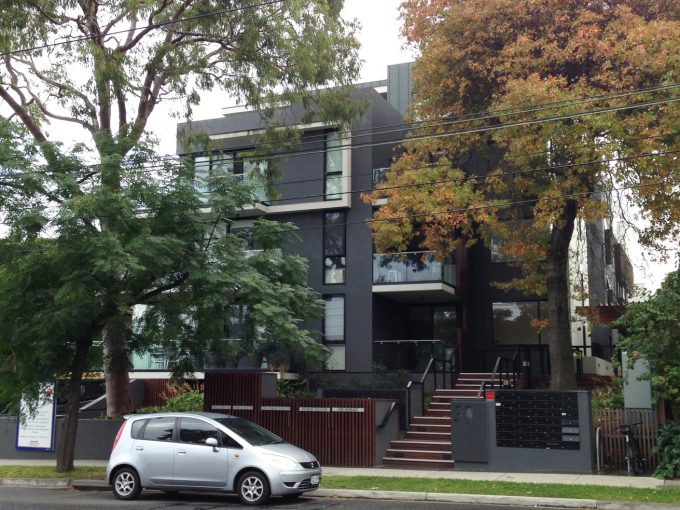
Yet, in inner-city Ashfield, the infill development of once-vegetated lands continues apace, with grass-to-hard-surface conversions accounting for most of its 7.3% loss of green space.
In some cases, local government areas are undergoing losses in a similar location. For example, the areas with the greatest losses in green space across Perth lie in a band that stretches from inland Melville to coastal East Fremantle. In these locations, the traditional Aussie backyard is losing ground to densification and infill.
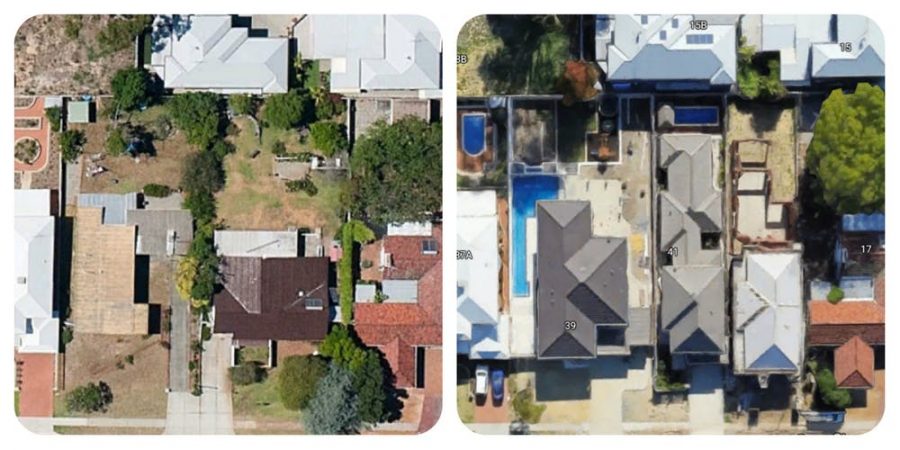
An example of changes in Melville, suburban Perth, between 2011 and 2017. Google Maps
How do our cities compare?
In recent years, interest in benchmarking exercises such as these has increased internationally. In the US in 2012, David Nowak and others examined the growth and decline in vegetation cover for 20 cities using the i-Tree methodology. US cities showed significant variability in combined tree and shrub canopy cover (54% for Atlanta to 10% in Denver).
The good news is that Greater Melbourne and Adelaide, both with 24% tree and shrub cover, perform better than the lowest values for the US cities. And Hobart’s shrub and tree cover of 57% is higher than Atlanta’s.
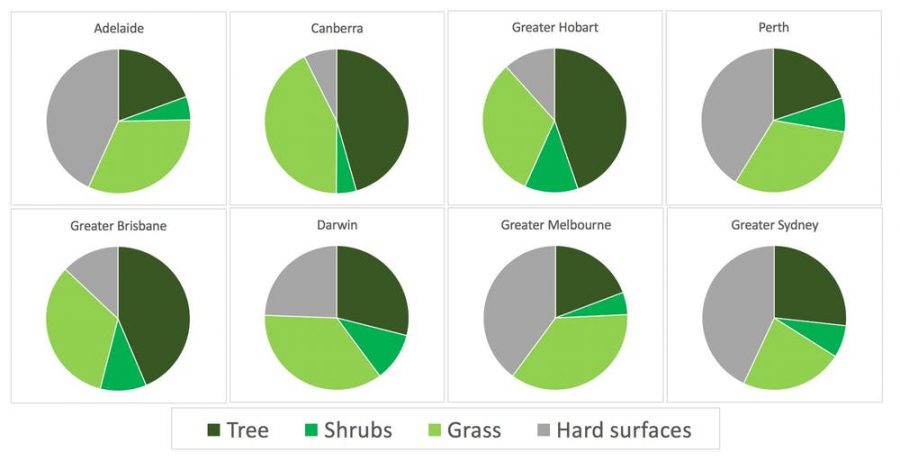
Benchmarks for land cover in Australian capital cities 2016-17. Where should all the trees go?/Marco Amati
Yet within Australian cities the variability is pronounced. Canopy covers range from 77% (Yarra Ranges, Vic) to 3% (Wyndham, Vic).
The US urban forest is also subject to natural forces like Australia’s. New Orleans lost the largest amount of canopy cover (10%) as the study period included the damage inflicted by Hurricane Katrina.
In the 1940s even cement companies were friends of the backyard. Source: The Australian Home Beautiful, October 1943
Yet, when considering the downward trend in greening, it is the historical comparison that is the most striking. The backyard was once an icon of the lifestyle enjoyed by generations of Australians growing up after the second world war.
If the downward trend in green cover continues, should the Australian backyard be red-listed as a threatened species?